How Your FIers Forecast Works
Forecasts are at the heart of how you'll plan your path to financial independence. You create a forecast by providing some basic information such as take home pay, mortgage payoff date and retirement account balances. That's all it takes and you'll instantly get back a detailed plan that shows your progress on a yearly basis up to and beyond financial independence.
Each forecast includes a graph and table which shows your path to financial independence.
Forecast Inputs
There are roughly 10 fields that you'll be asked to provide when creating a forecast.
- Forecast name - a descriptive name for your forecast.
- Income - your monthly take home pay after taxes and deductions.
- Expenses - your monthly expenses excluding any mortgage payments.
- Mortgage - your monthly mortgage payment including taxes, insurance and extra payments.
- Mortgage payoff year - the year you plan to pay off your mortgage (use a mortgage amortization calculator if needed).
- Debt - the total of all your debts combined excluding your mortgage.
- Debt payment - your total monthly minimum debt payments excluding extra payments.
- Brokerage balance - the total of all your post-tax investment accounts.
- Pre-tax ret. balance - the total of all your pre-tax retirement accounts (i.e. 401k and traditional IRA)
- Pre-tax ret. additional - your yearly pre-tax contribution including employer match
- Post-tax ret. balance - the total of all your post-tax retirement accounts (i.e. Roth IRA)
- Return rate - the rate of return you expect on your investments (do not factor in inflaction).
- Withdrawal rate - the percent of your nest egg you plan withdraw once you reach financial independence.
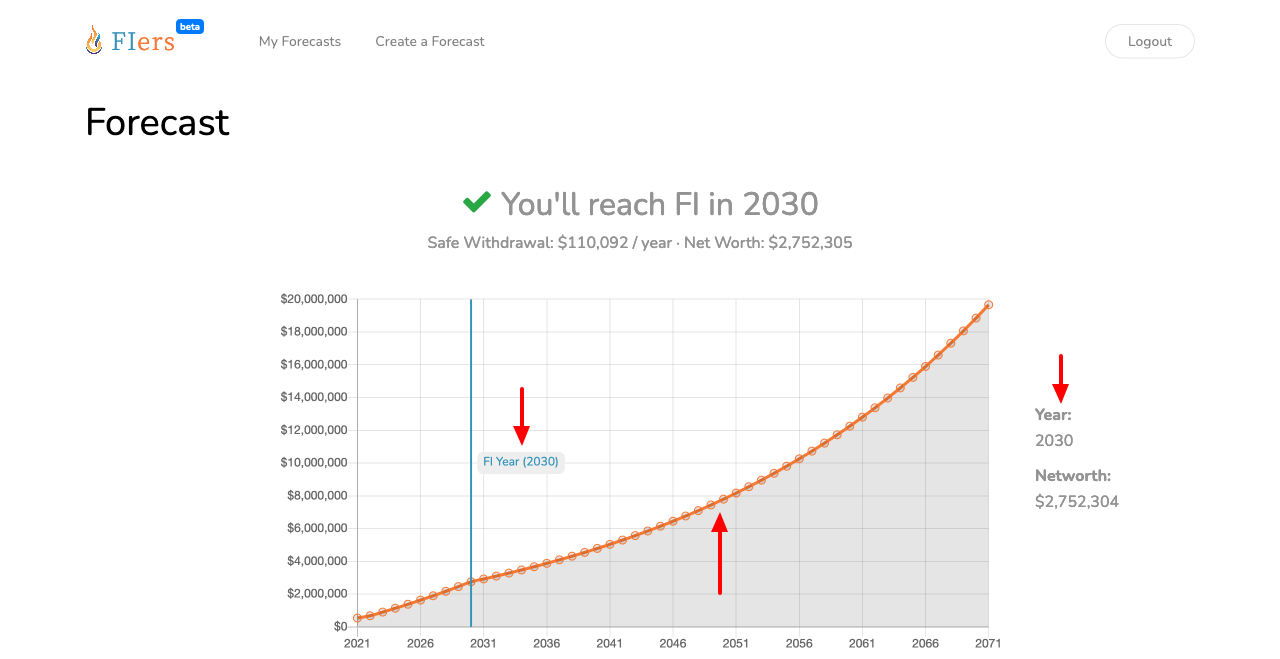
Forecast Graph
The forecast graph is a straight-forward way to visualize how your nest egg will grow. It's a great way to see the trend your forecast puts you on.
- Line graph - growth of nest egg including interest + yearly additions.
- Vertical line - year which you'll reach financial independence.
Forecast Table
The forecast table is a year-by-year detailed breakdown of your money. The table includes a lot of information in an easy to understand explaination of what's happening with finances.
- Year - values reflected as of the end of the year.
- Income - yearly take home pay after taxes and deductions.
- Expenses - yearly expenses excluding mortgage.
- Surplus - amount left over after subtracting expenses from income.
- Mortgage - yearly mortgage payments made including taxes, insurance and extra payments.
- Debt - yearly total of minimum debt payments made excluding mortgage.
- Ret. (pre-tax) - yearly balance of all pre-tax retirement accounts.
- Ret. (post-tax) - yearly balance of all post-tax retirement accounts.
- Investments - yearly balance of all taxable investment accounts.
- Net Worth - yearly networth of all accounts without including home equity.
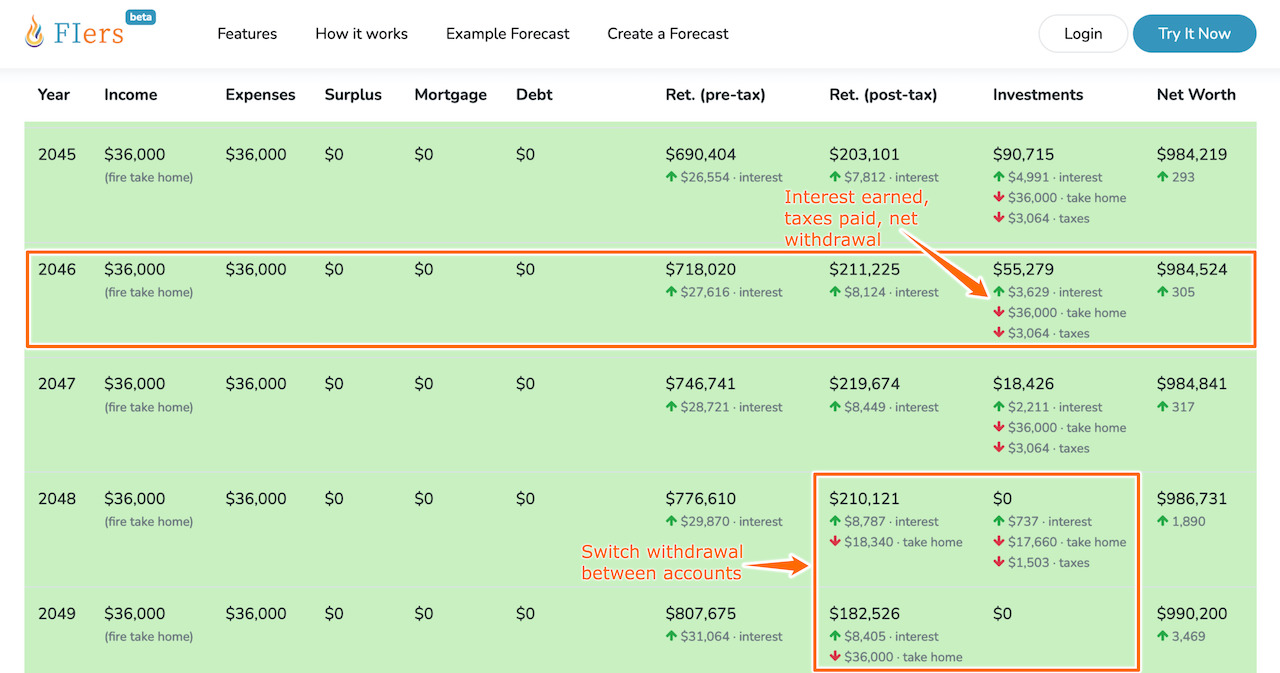
You'll notice that certain columns may contain a subtext and green () or red arrow (). Each of these represent an increase or decrease for that column by the dollar amount next to the arrow. The label following the dollar amount indicates where the money came from. It might be from interest or payroll contributions.
- interest - interest from the previous year's balance.
- payroll - pre-tax deducations from your paycheck.
- surplus - contribution from money you saved that year.
The more familiar you get with the forecast table, the more you'll feel in control of your path to financial independence. You can easily add up the numbers to understand how your money is growing and the impact of both decreasing expenses and increasing income. This should equip you to decide what steps to take to reach your goals.
How Our Calculations Work
The calculations used in your forecast make several assumptions that are important to understand.
Your Financial Independence Year
Your forecast indicates financial independence based on how well your net worth will cover your expenses for that year.
- Expenses - $36,000
- Withdrawal Rate - 4% (or .04 in the form)
You'll need a net worth of $36,000 ÷ .04 which is $900,000 to be financially independent. This means with a net worth of $900,000 you can safely withdraw $36,000 each year for 30 years before running out of money.
Nothing is guaranteed so make sure you factor in whatever buffer makes you feel comfortable into your forecast.
Income
Your take home pay is your most valuable asset in building wealth. Unfortunately, deductions and taxes are used for other important purposes, so we exclude them. Any 401k contribution or employer match is calculated separately so it's okay to leave them out of your income.
Expenses
Both your expenses and debts work against you but in different ways. Predictability in your expenses is very important if you want to make a plan of any kind. Once you determine an appropriate budget then provide your monthly living expenses. This should include food, rent (but not mortgage), entertainment, etc.
Surplus
Your income minus your expenses is considered a surplus. Your surplus is divided up in the following manner.
- Pay off consumer debt. If you have no consumer debt or your suplus is greater than your debt balance, then the remainder is put towards the next item.
- Fund your Roth IRA. We put up to $6,000 into a Roth IRA and if there is still surplus left over, we put it towards the next item.
- Add to your post-tax investment accounts. All that's left over goes into your post-tax investments since this has no limits.
If you are married, you can technically put up to $12,000 into a Roth IRA but the differences are negligible enough that we do not need to worry too much about it. One reason we fund your Roth IRA is because you're able to withdraw money without penalty using Rule 72(t).
Mortgage
Our calculation treats your mortgage as a fixed term liability and your home's equity is not factored into your net worth. Since your mortgage is a predictable expense which lasts a fixed period of time we only need to know your total monthly cost and how long you'll be paying it.
If you're not making any extra payments, you can find both your monthly payments and your payoff date on your mortgage statement. Be sure to include taxes and insurance if they are not part of your monthly payment and make sure to average it out as monthly.
If you do make additional payments, use a mortgage amortization calculator to see the year it will be paid off.
Debt
Our calculation assumes that your consumer debt total will have an average interest rate of 8%. Interest rates aren't what make or break a forecast and paying off your debt as soon as possible makes the interest rate less important.
We assume that 75% of your monthly debt payment goes toward principal. Extra money (your surplus) first goes to pay off any remaining balance. Once your debt is paid off, the money which used to go toward payments is freed up.
Investments and Return Rate
The return rate you specify will be applied to all of your pre-tax and post-tax investments. Our calculation factors in a 3% rate of inflation automatically so you should not factor it in yourself. If the interest gained in your investment accounts don't add up, then reduce your interest rate by 3% and calculate it again.
Withdrawal Rate
The withdrawal rate is the percent of your nest egg that you're comfortable taking out for living expenses. If your withdrawal rate is too high, you will take too much out of your nest egg and will run out of money. In order to avoid running out of money you should pick a Safe Withdrawal Rate. Use 4% (or .04 in the form) if you're unsure.